Shear and Moment Diagrams: How to Draw SFD and BMD
How to draw shear and moment diagrams (SFD and BMD) step by step: 7 worked beam examples, interactive figures and a free calculator to check your homework.
Key takeaways
- The slope of the shear diagram is minus the distributed load (dV/dx = −w), and the slope of the moment diagram is the shear (dM/dx = V).
- Shear jumps at point loads, and the moment jumps at point moments.
- The moment is extreme where the shear is zero or changes sign, so mark those points and compute M there.
- The moment is zero at free ends, at end pins and rollers, and at hinges, unless a moment acts at that point.
- At a free or pinned right end, both diagrams return to zero once you add the last reaction or load: a quick check of your whole calculation.
In this article
- What shear and moment diagrams show
- Sign convention
- The rules that make drawing fast
- How to draw shear and moment diagrams step by step
- Shear and moment diagram examples
- Continuous and other statically indeterminate beams
- Common mistakes on homework and exams
- Check any beam with the free shear and moment diagram calculator
A shear and moment diagram, also called a shear force and bending moment diagram (SFD and BMD), plots the internal shear force and the bending moment along a beam. To draw one by hand, find the support reactions, then walk along the beam from left to right with three rules: a point load makes jump, a distributed load gives a slope, and the area under the diagram is the change in . The free calculator below draws the SFD and BMD for any beam you build, so you can check every example in this guide.
What shear and moment diagrams show
Cut a beam at any section . The bending moment and shear force at the cut keep the left part in equilibrium. The shear force is the sum of the vertical forces to the left of the cut, with upward forces counted positive. The bending moment is the moment of those same forces about the cut, with sagging counted positive. Sagging means the beam bends like a smile.
Try it: move the cut and watch the internal and that keep the left part in equilibrium, and the same values on the diagrams below.
The shear force diagram (SFD) is the graph of , and the bending moment diagram (BMD) is the graph of . You need them because the design checks look at the peaks. The bending stress check uses the largest , and the shear design uses the largest . If you then need the stresses at a point of the critical section, the Mohr’s circle guide shows how to transform them.
Sign convention
Most mistakes in shear and moment diagrams are sign mistakes, so fix the convention before you calculate anything.
- Positive shear: on a small beam element, the shear force on the left face points up and the one on the right face points down.
- Positive moment: sagging. The beam bends like a smile and the bottom fibres are in tension.
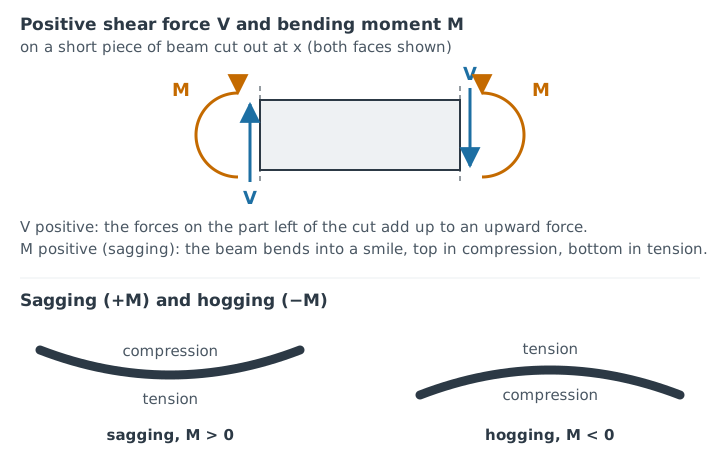
A second choice has nothing to do with the sign of the moment: on which side of the beam you plot the BMD. This guide draws the moment on the tension side, as German and Dutch textbooks and design tables do, so a sagging moment appears below the axis, on the side of the tensioned bottom fibres. The tension side is also where the reinforcement of a concrete beam goes. The TU Delft course note on deformation signs explains the tension-side drawing. Most US textbooks plot positive (sagging) moment above the axis instead, as in Fig 2.
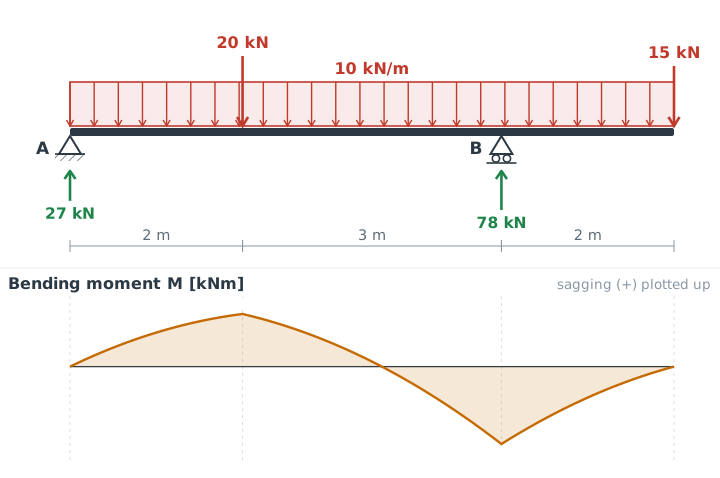
Both drawings show the same moments; check which one your course uses. The calculator has a switch for it.
The rules that make drawing fast
Let be the distributed load in force per length (kN/m or kip/ft), positive when it acts downward. Then the slope of each diagram follows from the one above it:
Integrate both equations between two sections and with no point load or point moment between them, and you get the form you use for hand calculations:
The first says the change in shear is minus the area under the load. The second says the change in moment is the area of the shear diagram. Point loads and point moments add the jumps below on top of these areas. This is why you rarely need to write for the whole beam: you add up areas of instead.
Concentrated actions make the diagrams jump:
- A downward point load makes drop by at that point.
- A clockwise point moment makes jump up by at that point.
The shape of each diagram on a segment depends on the load on it:
| Load on the segment | Shape of V | Shape of M |
|---|---|---|
| No load | Constant | Straight line |
| Uniform load (UDL) | Straight sloped line | Parabola (2nd degree) |
| Linearly varying load | Parabola | Cubic |
| Point load | Jump | Kink |
| Point moment | No change | Jump |
M is drawn on the tension side: sagging (positive) moment below the axis.
How to draw shear and moment diagrams step by step
- Draw the free body diagram. Sketch the beam, replace each support by its reaction forces, and mark every load with its position. A free online tool such as Statics Sketcher lets you draw the beam with its supports and loads, and the Statics Sketcher guide shows how.
- Find the reactions. Take moments about one support () to get the other reaction, then use to get the first one.
- Draw V from left to right. Start at zero left of the beam. Jump up by an upward reaction, jump down by a downward load, and slope the line downward under a distributed load.
- Draw M from the areas of V. Start from the moment at the left end: zero at a pin, roller or free end unless a moment acts there, and minus the wall moment at a fixed left end (Example 3). Add the area of the V diagram segment by segment, and add a jump at each point moment.
- Mark every point where V is zero or changes sign and compute M there. These are the candidates for the maximum.
- Check the ends. At a free or pinned right end both diagrams must come back to zero once you add the last reaction or load. At a fixed end they must match the wall reactions: the shear equals the reaction force, and the moment has the size of the wall moment, with its sign from the convention (hogging is negative).
Shear and moment diagram examples
Every result below was recomputed with exact arithmetic, and the calculator gives the same values. Try to sketch the diagrams yourself before you read the results.
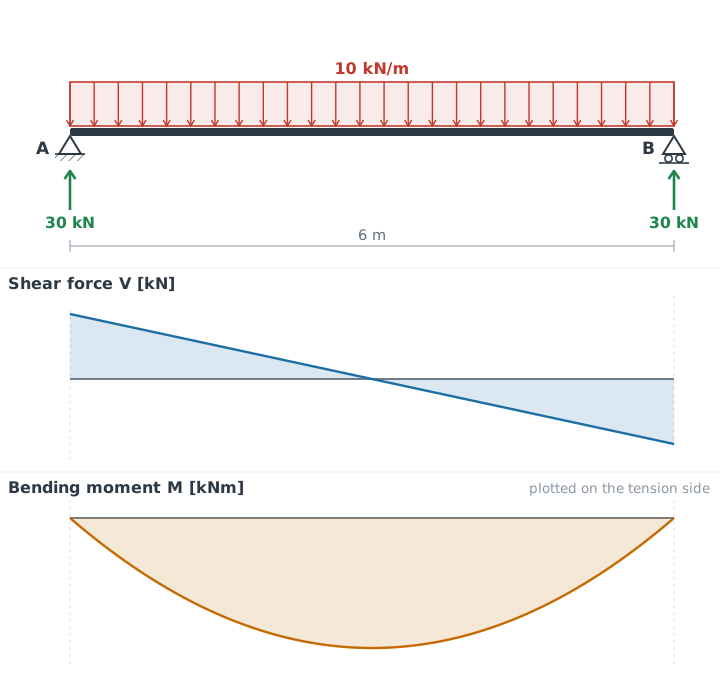
Example 1: Simply supported beam with a uniformly distributed load
A beam spans m and carries kN/m over its whole length. By symmetry each support takes half the load:
The shear starts at 30 kN and falls along a straight line, . It reaches zero at m, the middle of the span. The moment is a parabola, , and it peaks where :
Example 2: Simply supported beam with an off-centre point load
A beam spans m with a point load kN at m from A, so m from B. The closer support carries more of the load:
The shear is +18.75 kN up to the load, drops by 30 kN to −11.25 kN at the load, and stays there to B. With no load between the point load and the supports, is constant and is a straight line. The moment grows from 0 to its largest value under the load and returns to 0 at B:
You can check it with the area rule: from the left, and from the right.
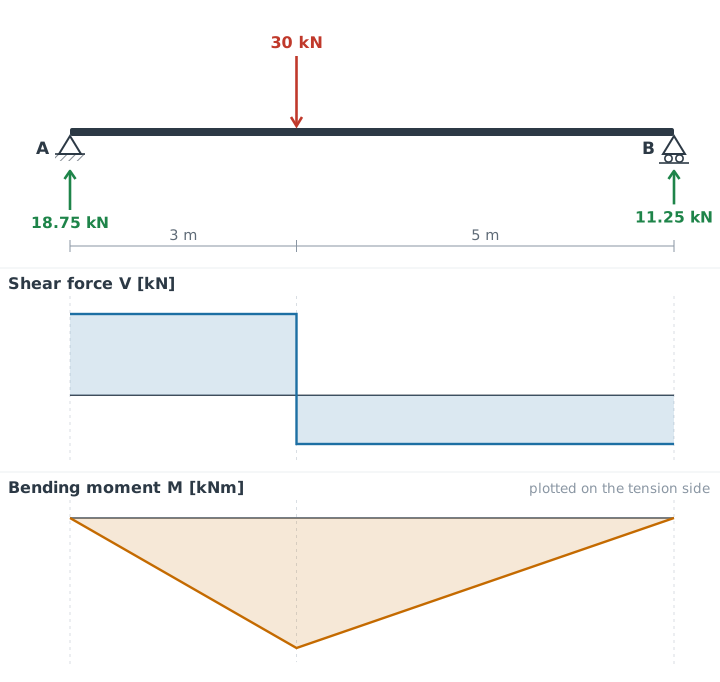
Now move the load: the nearer support carries more of it, and the peak moment always sits under the load, largest at midspan ().
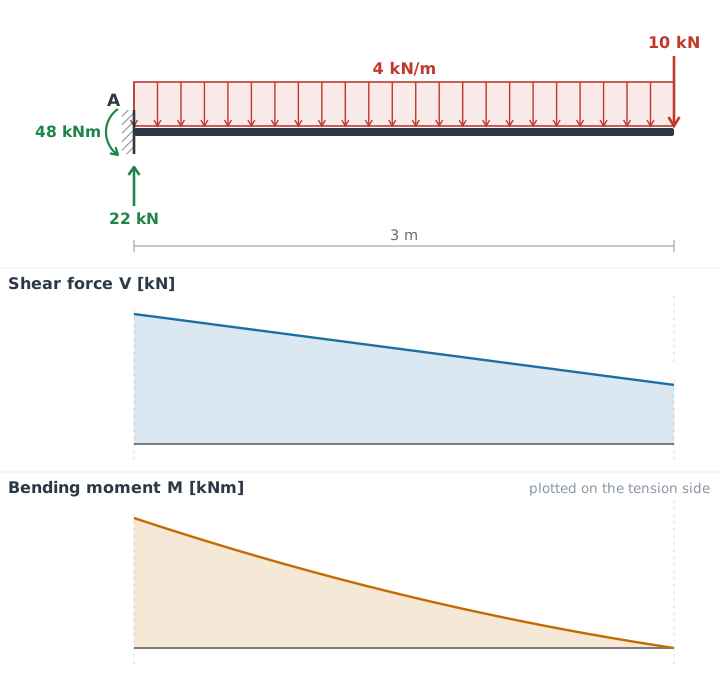
Example 3: Shear force and bending moment diagram of a cantilever beam
A cantilever is fixed at A on the left and has length m. It carries kN/m over the whole length and a point load kN at the free end. The two basic cantilever cases follow the same pattern: a tip load alone gives along the whole beam and at the wall, and a uniform load alone gives and at the wall.
The wall supplies a force and a moment:
The wall moment is kNm, counter-clockwise. In the sign convention above this gives kNm. The shear falls along and reaches 10 kN just before the tip, where the point load takes it to zero. The moment is
and , so the diagram closes at the free end. The cantilever hogs over its whole length (the top fibres are in tension), and the largest sits at the wall.
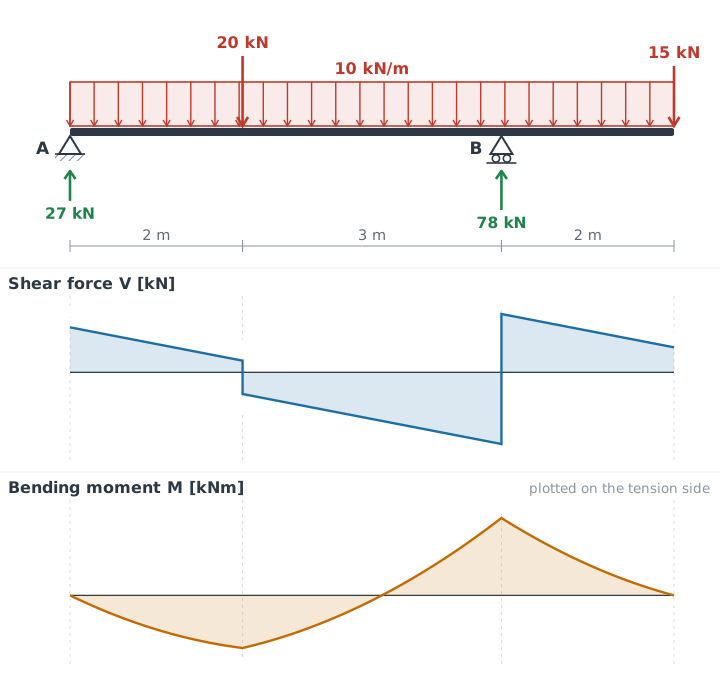
Example 4: Overhanging beam
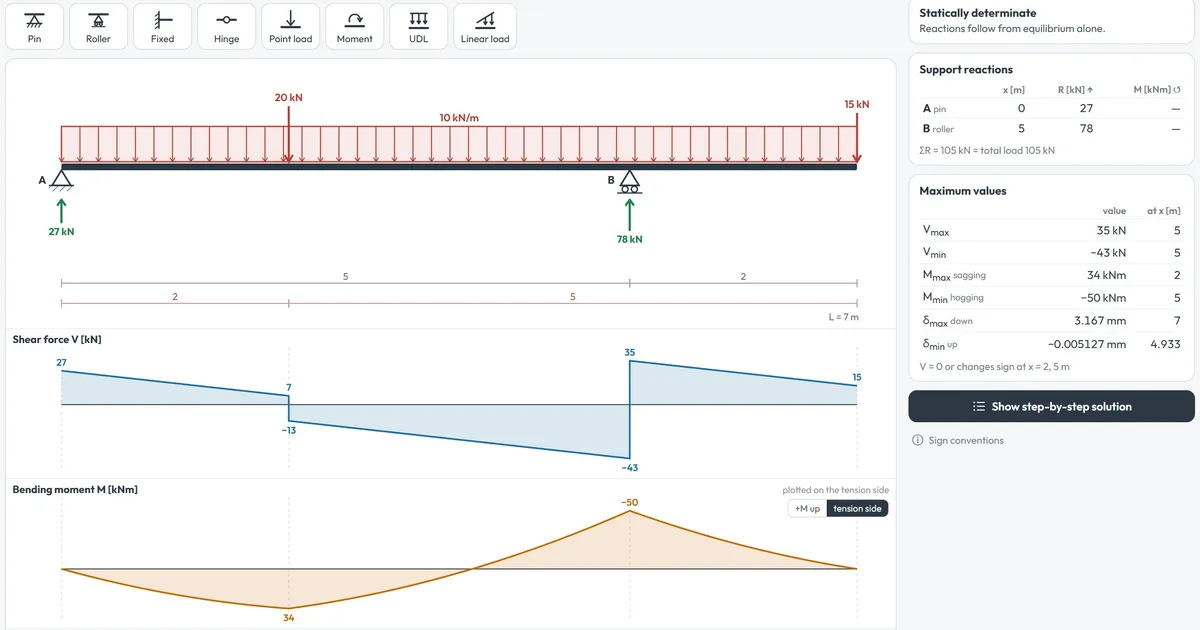
Pin A is at and roller B at m. The beam is m long, so it overhangs B by 2 m. Loads are kN/m over the full 7 m, a 20 kN point load at 2 m, and a 15 kN point load at the tip, m.
Take moments about A. The UDL resultant is 70 kN at 3.5 m:
Then kN, because the total load is 70 + 20 + 15 = 105 kN.
Walk the shear from left to right. It starts at 27 kN at A and falls to 7 kN just left of the 20 kN load. The load drops it to −13 kN, and it keeps falling to −43 kN just left of B. The roller adds 78 kN, so the shear becomes +35 kN and falls to 15 kN at the tip, where the 15 kN load brings it to 0.
For the moment, kNm at m, and kNm over B. Between the supports the moment crosses zero at m, the positive root of .
Look at the +34 kNm peak. The shear does not pass through zero there. It changes sign by jumping at the point load, from +7 kN to −13 kN, and the moment still has its local maximum at that spot.
Example 5: Triangular load in US units
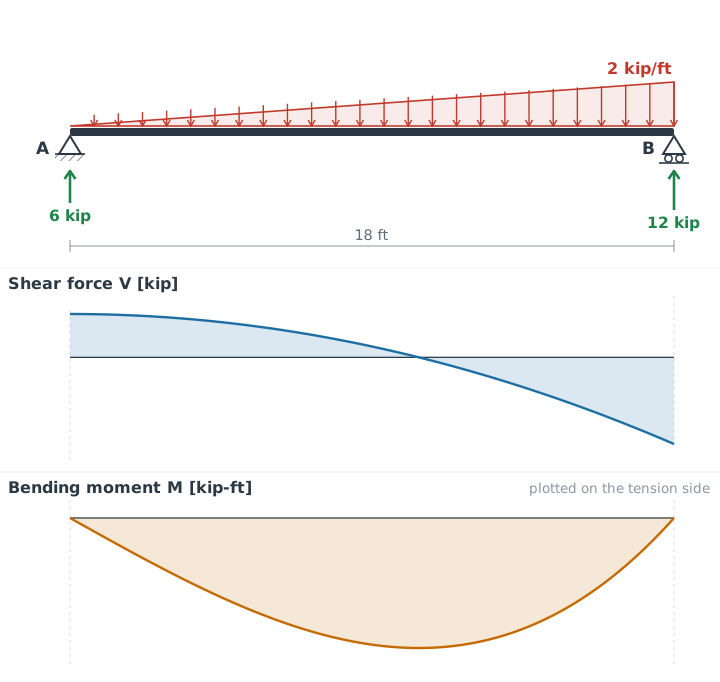
A simply supported beam of ft carries a load that rises linearly from zero at A to kip/ft at B. The total load is
and it acts at the centroid of the triangle, from B, the heavy end. Moments about each support give
The load grows with , so the shear is a parabola and the moment is a cubic:
The shear is zero at ft, which is where the moment peaks:
The peak is beyond midspan, on the side of the heavier load.
Example 6: Point moment on a beam
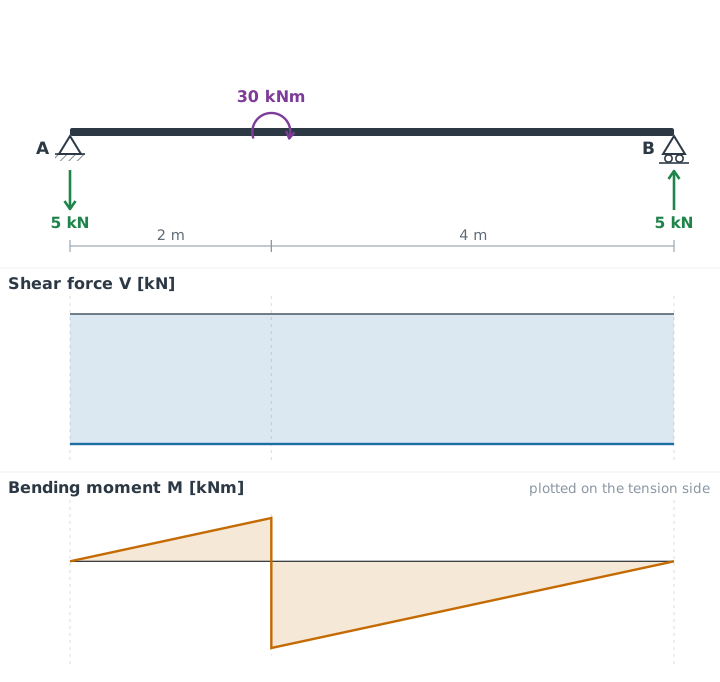
A simply supported beam of m carries a clockwise moment kNm at m. There is no vertical load, but the couple still needs reactions that form an opposing couple. They are
The shear is kN everywhere, because no vertical force acts between the supports. The moment falls along to −10 kNm just left of m, jumps by +30 kNm to +20 kNm, and then falls with the same slope back to 0 at B.
A couple changes but not . That is the last row of the table above.
Continuous and other statically indeterminate beams
Equilibrium gives you two equations for a beam, plus one more for each internal hinge. A continuous beam or a fixed-end beam has more unknown reactions than that, so you also need the deflection conditions. The usual hand methods are the three-moment equation and slope-deflection. Software uses the stiffness method.
When the whole beam has one and the supports do not settle, the values of and do not change and ; they only change the deflections. A support settlement is different: then the moments grow with .
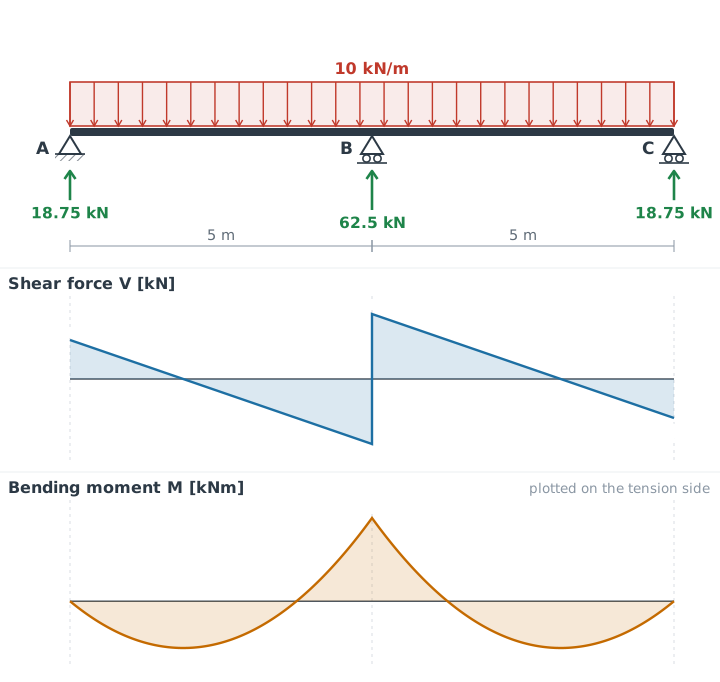
Example 7: Two-span continuous beam
Two spans of m each carry kN/m. The end supports A and C are pins or rollers, so , and the three-moment equation for the middle support B reads
With known, each span is a simply supported beam with an end moment, and the reactions follow:
The largest moment inside a span is kNm, at m from the end supports.
Common mistakes on homework and exams
- Wrong sign after a point load. A downward load makes drop. Write the jump next to the diagram before you continue.
- Forgetting the jump at a point moment. The BMD jumps by and the SFD does not change.
- Looking for the maximum moment only where . The maximum can also sit where jumps through zero at a point load, as in Example 4.
- Placing the triangular load resultant at mid-length. It acts at the centroid, from the heavy end (Example 5).
- Writing a moment at a free end when no moment acts there. A free end, an end pin or an end roller has zero moment unless a point moment is applied.
- Mixing units. kNm with Nmm, or ft with in, ruins an otherwise correct diagram.
- Not checking the ends. If V or M does not return to the expected value at the right end, a reaction or an area is wrong.
Check any beam with the free shear and moment diagram calculator
Use the calculator to confirm your hand diagrams or to try a load case you do not have a solution for. It is free, runs in the browser and needs no sign-up.
- Build the beam. Pick a template (15 typical beams, from a simply supported beam to a four-span continuous beam), or click the palette buttons “Pin”, “Roller”, “Fixed” or “Hinge” and the load buttons “Point load”, “Moment”, “UDL” and “Linear load”. You can also drag a button onto the beam.
- Set the numbers. Click an item to open a small editor with its numbers. Set the beam length in the field “L”, or point at a span and drag the small ↔ handle under it to change the length of that span. A negative value acts upward, and the reverse direction button flips a load.
- Read the results. The reactions appear as green arrows under the supports, and the SFD, the BMD and the deflection diagram update instantly and line up under the beam, with the key values labelled. The calculator also lists the largest and smallest , and deflection with their positions, and the points where is zero or changes sign.
- Open the step-by-step solution. The hand calculation is written out as formulas: the load resultants and their positions; about each support (simply supported beam) or and (cantilever); for other beams the degree of indeterminacy and, if needed, the compatibility conditions; then the reactions with a check, and for each segment and the largest moments.
- Switch units, export or share. Change between SI and US units, switch the moment convention between “+M up” and “tension side”, export SVG, PDF, PNG or JPG, or copy a link that reopens the same beam.
Enter and in the header of the deflection diagram. They are labelled “for deflection only”. The model covers a straight horizontal beam with transverse loads, linear elastic Euler-Bernoulli bending and one for the whole beam. Frames, inclined members, axial forces, springs and temperature loads are outside it.
The solver was tested against the beam tables of Schneider Bautabellen, worked examples from Hibbeler’s Structural Analysis, an exact rational-arithmetic solution of about 445 beams, and the open-source FEM program anaStruct. Use it to check your own work, not to replace it.
Frequently asked questions
What are SFD and BMD?
SFD is the shear force diagram and BMD is the bending moment diagram. They are graphs of the internal shear force V(x) and the internal bending moment M(x) along the length of a beam. Engineers use them to find the sections with the largest shear and the largest bending moment.
Where does the maximum bending moment occur?
Because dM/dx = V, the moment has a local maximum or minimum where the shear is zero or changes sign. This can be inside a span (for example under a uniform load) or at a point load, where the shear jumps through zero. Also check the supports: at the wall of a cantilever, the largest moment sits at the fixed end.
What is the relationship between shear force and bending moment?
The shear force is the slope of the bending moment diagram, dM/dx = V. Equivalently, the change in bending moment between two sections equals the area under the shear force diagram between them, as long as no point moment acts between the two sections.
How do you draw the shear force and bending moment diagram of a cantilever beam?
Find the reaction force and the reaction moment at the fixed end, then walk along the beam and apply the load, shear and moment rules. The moment is zero at the free end. At the fixed end the shear equals the wall reaction and the moment has the size of the wall moment, negative (hogging) in the usual convention. For the two basic cases: a tip load P gives V = P and M = −PL at the wall, a uniform load w gives V = wL and M = −wL²/2 at the wall. Example 3 below works through a cantilever with a uniform load and a tip load.
Is there a free shear and moment diagram calculator?
Yes. The UnborEng Shear & Moment Diagram Calculator is free, runs in the browser and needs no sign-up. Build a beam with pins, rollers, fixed supports, hinges, point loads, moments and distributed loads, and it draws the reactions, the shear force diagram, the bending moment diagram and the deflection, with a step-by-step hand calculation in SI or US units.
Why is the bending moment zero at a pin or roller support?
A pin or a roller cannot resist rotation, so it supplies no reaction moment. At the end support of a beam, no force lies beyond the support to create a moment about it, so the moment there is zero unless an external moment acts at that point. Over an interior support, such as the middle support of a continuous beam or the roller next to an overhang, the moment is usually not zero.